Francisco Ferreira
Data Analyst - SQL · R · Power BI · Tableau
DATA
ANALYST
I'm a data analyst with a background in digital marketing, now focused on transforming data into insights that drive smart decisions.
After years managing performance campaigns across global markets, I shifted my focus fully to analytics, collecting, cleaning, and visualizing data to uncover trends and support strategy.
I work with tools like SQL, Python, Excel, and Tableau to build dashboards, automate reporting, and bring clarity to complex datasets.
I'm driven by curiosity, clear communication, and the belief that data is most powerful when it tells a story and leads to action. Because data is indeed everywhere.
PREMIUM
TOOLS
SQL
Querying, transforming, and analyzing dataR + Tidyverse
Data wrangling, visualization, and modelingPython + Pandas
Data cleaning, analysis, and automationPower BI
Interactive dashboards and business insightsExcel
Spreadsheets, charts, and formulasPowerPoint
Presentation design and storytellingCanva
Visual design for marketing & brandingGoogle Stack
Ads, Analytics, Tag Manager, Merchant CenterBigQuery + Looker
Cloud data and live dashboardsTableau
Data storytelling with visual analyticsMySQL
Relational database managementRECENT
PROJECTS
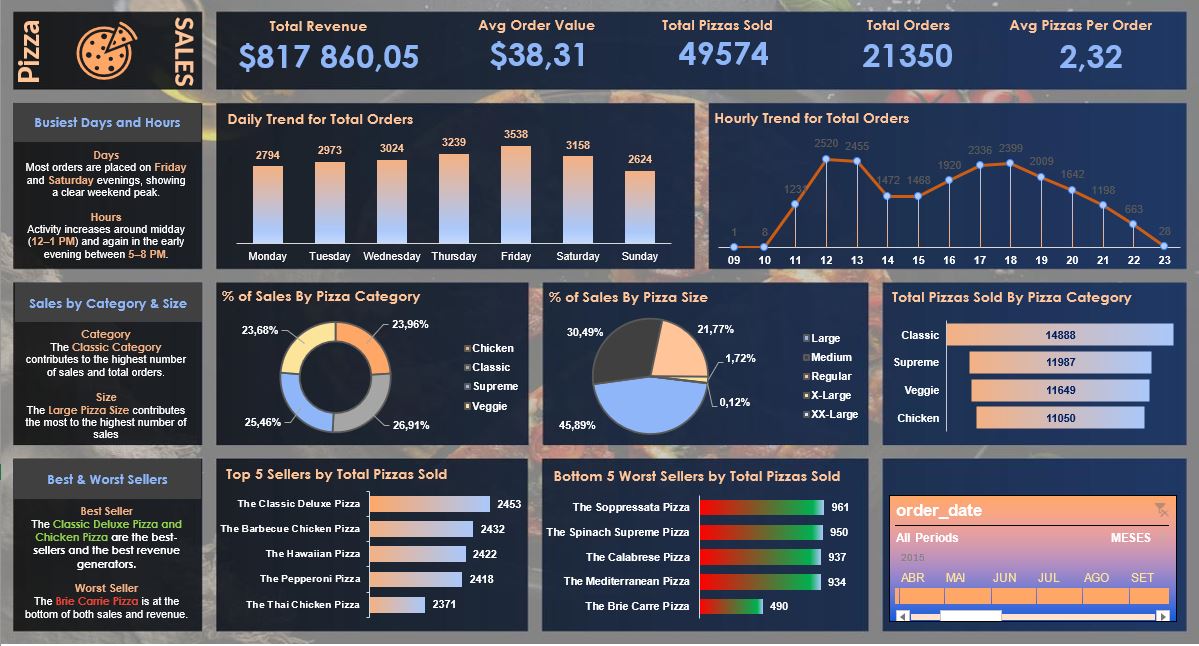
Pizza Sales Performance Dashboard
A growing local pizzeria needed better visibility into their sales,
product performance, and customer behavior. I designed an interactive
dashboard to help them understand when and what customers order, which
pizzas sell best (or worst), and how sales trend by time and category.
💡 Tools used: Excel, SQL Queries, PowerPoint.
📊 Focus: Sales analysis, product insights, dashboard design.
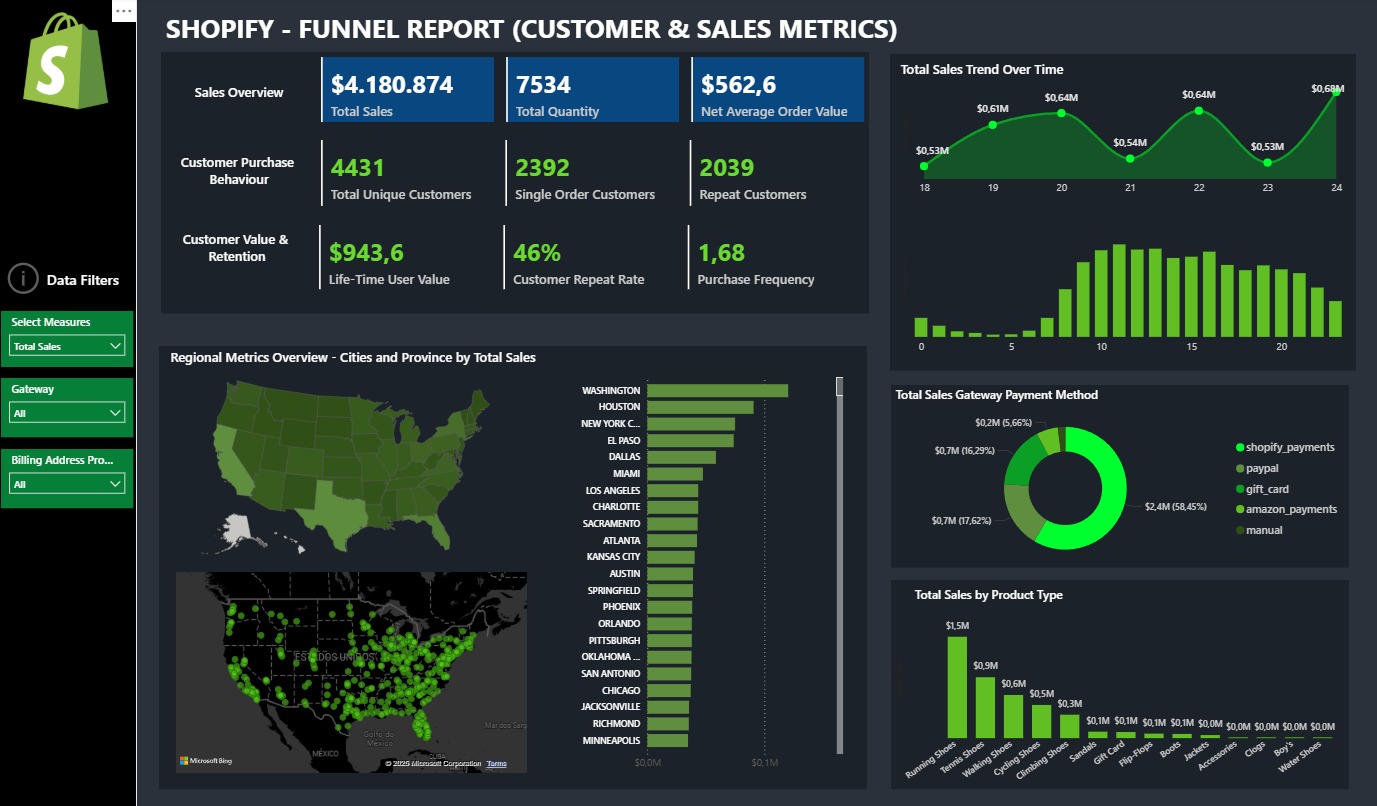
Shopify Sales & Customer Funnel Dashboard
Built a dynamic funnel dashboard using Shopify sales data to help
stakeholders monitor performance, understand customer behavior, and
evaluate long-term customer value. Insights include repeat rates,
order frequency, sales by location, and payment trends.
💡 Tools used: Power BI, Excel, and PowerPoint.
📊 Focus: Customer behavior, retention metrics, funnel analysis.
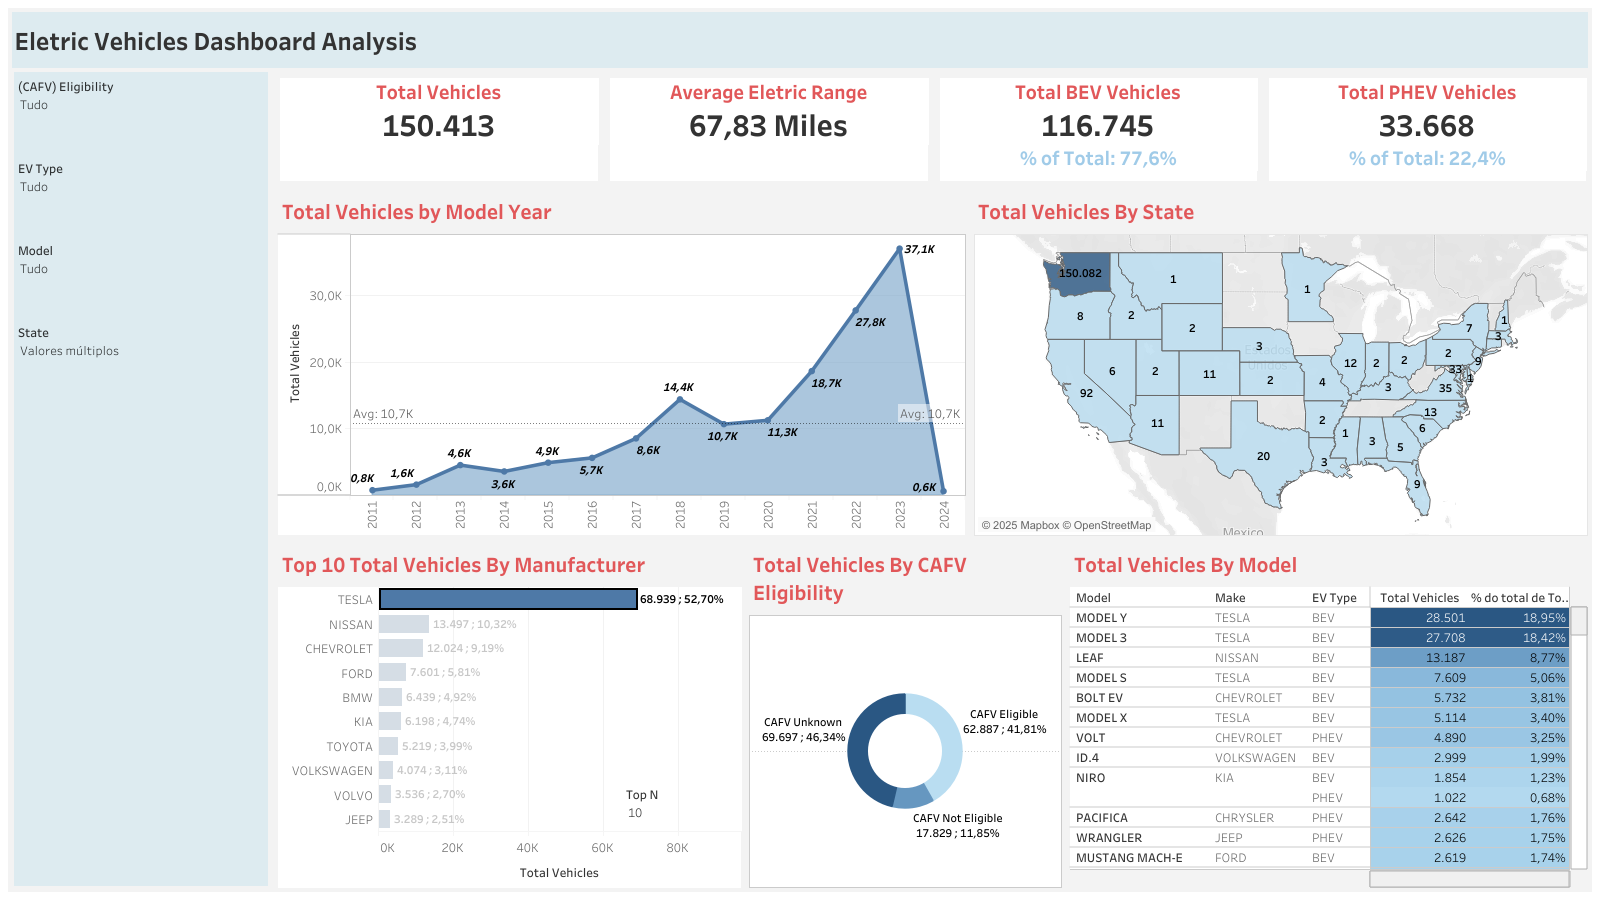
Electric Vehicle Growth & Market Insights Dashboard
Analyzed EV registration data across the U.S. to uncover adoption
trends, manufacturer market share, and battery tech progress.
Visualizations include growth by model year, geographic spread, CAFV
eligibility, and top-performing EV models and brands.
💡 Tools used: Tableau, Excel, PowerPoint.
📊 Focus: Market trends, geographic insights, tech evolution,
consumer preference.